Prologue
Sorted by alphabetical order of the name of the function
Plotting
Annotation
Rotate an ellipse
The ellipse drew by annotation in MATLAB does not support Rotation property until R2022a(see Reference 1). The supported properties of the Ellipse object in R2020b are listed as follow.
ha = annotation('ellipse');
>> ha

ha =

  Ellipse with properties:

             Color: [0 0 0]
         FaceColor: 'none'
         LineStyle: '-'
         LineWidth: 0.5000
          Position: [0.3000 0.3000 0.1000 0.1000]
             Units: 'normalized'
      BeingDeleted: off
        BusyAction: 'queue'
     ButtonDownFcn: ''
          Children: [0×0 GraphicsPlaceholder]
             Color: [0 0 0]
       ContextMenu: [0×0 GraphicsPlaceholder]
         CreateFcn: ''
         DeleteFcn: ''
         FaceColor: 'none'
  HandleVisibility: 'on'
           HitTest: on
     Interruptible: on
         LineStyle: '-'
         LineWidth: 0.5000
            Parent: [1×1 AnnotationPane]
     PickableParts: 'visible'
          Position: [0.3000 0.3000 0.1000 0.1000]
          Selected: on
SelectionHighlight: on
               Tag: ''
              Type: 'ellipseshape'
             Units: 'normalized'
          UserData: []
           Visible: on
Solution
So, in older version of MATLAB, in order to draw a rotated ellipse, a x-y pair have to be generated according to the ellipse equation:
\[\frac{x^2}{a^2}+\frac{y^2}{b^2} = 1,\]and consider rotation matrix:
\[\begin{bmatrix} x' \\ y' \\ \end{bmatrix} = \begin{bmatrix} \cos\theta & -\sin\theta \\ \sin\theta & \cos\theta \\ \end{bmatrix}\begin{bmatrix} x \\ y \\ \end{bmatrix}.\]Then use plot function to draw it.
Here is a fragment of reference code:
% Some drawing codes

hold on;
majorAxis = 70;
minorAxis = 35;
centerX = 95;
centerY = 35;
orientation = 50;

theta = linspace(0, 2*pi, 150);
orientation=orientation*pi/180;
xx = (majorAxis/2) * sin(theta) + centerX;
yy = (minorAxis/2) * cos(theta) + centerY;

xx2 = (xx-centerX)*cos(orientation) - (yy-centerY)*sin(orientation) + centerX;
yy2 = (xx-centerX)*sin(orientation) + (yy-centerY)*cos(orientation) + centerY;
plot(xx2,yy2)
Reference
Updated at 30 Oct, 2023
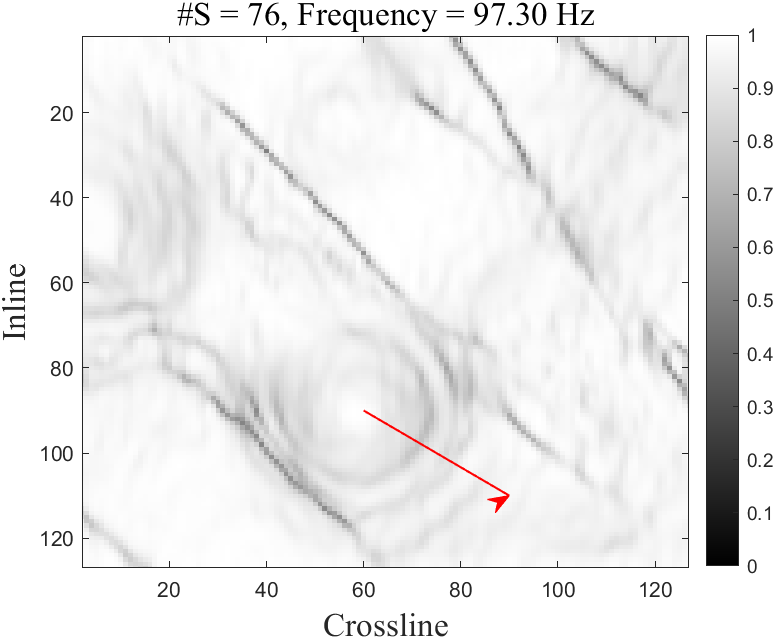
The arrow head of annotation is not aligned with the arrow body
Code like this will generate an improper arrow whose arrow line is not aligned with the arrow head.
hannotation = annotation('arrow');
hannotation.Parent = gca;
hannotation.Color='r';
hannotation.Position = [60, 90, 30, 20];
hannotation.LineWidth = 1;

Solution
If you don’t care about the y-axis direction, add:
set(gca,'YDir','normal')
Or, if the direction of y-axis does matter to you, try to use another implementation of annotation in Annotation
Reference
Updated at 30 Oct, 2023